
AirQo Nexus
Real-time air quality data platform
Client: AirQo
What it is
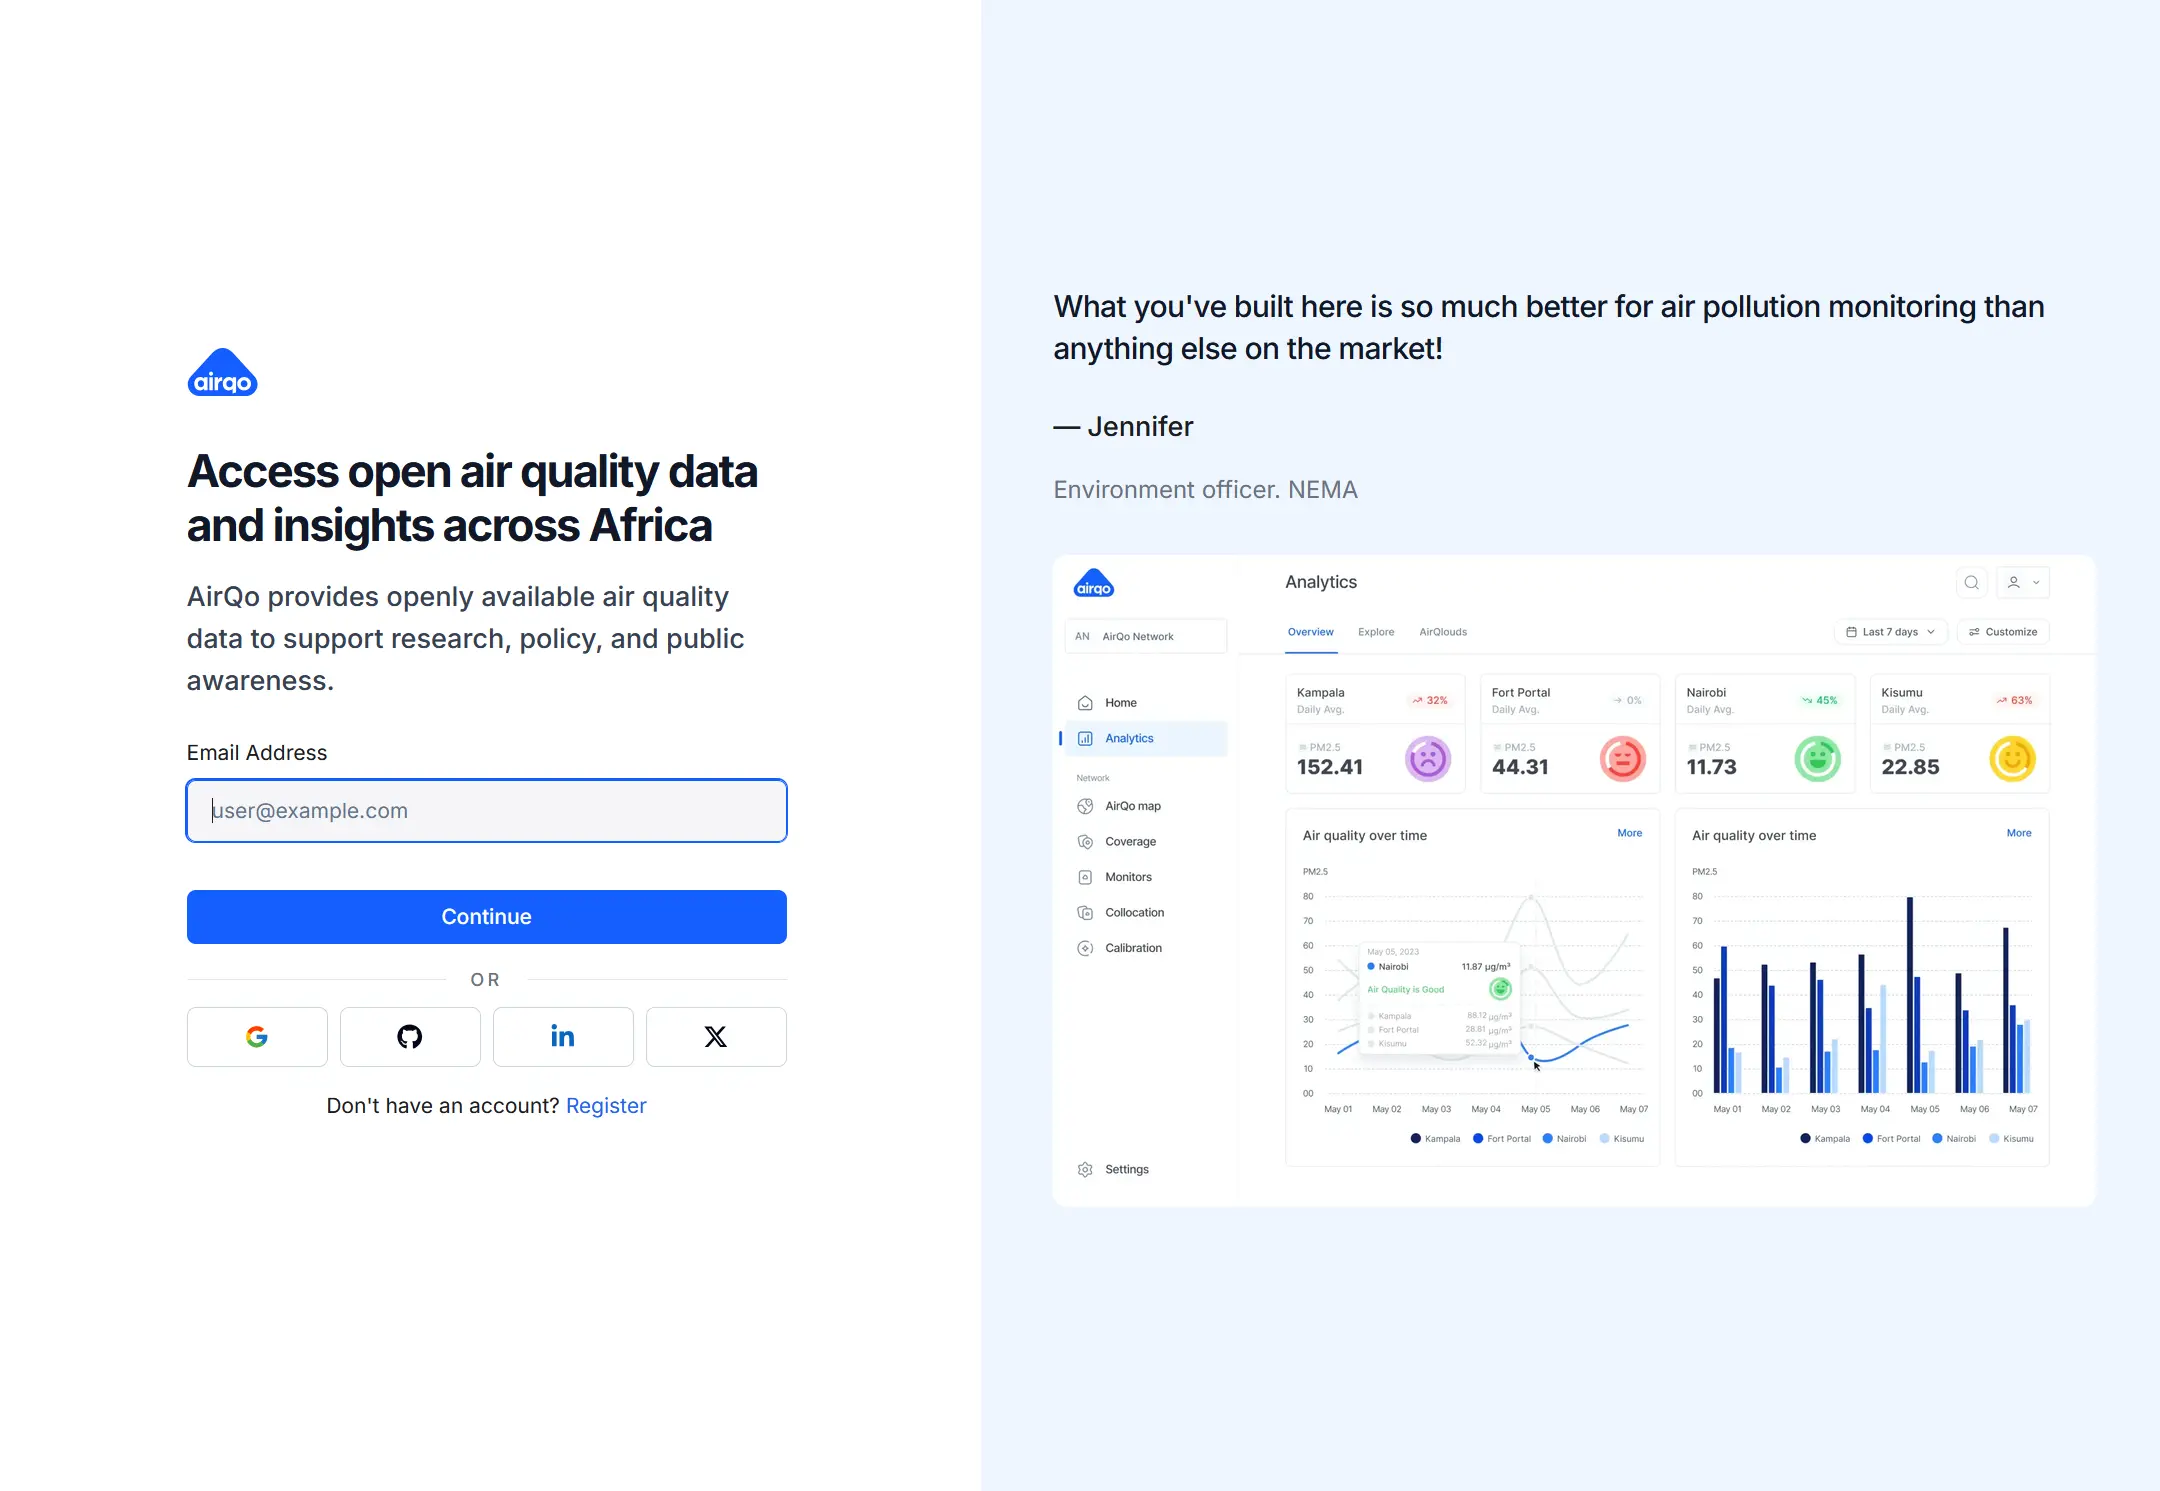
The interactive analytics platform for AirQo, visualizing real-time and historical air quality data from Binos monitoring stations across African cities. Provides dashboards, interactive maps, and historical trend analysis for researchers, city planners, and communities.
The Problem
Air quality data in Africa is sparse, fragmented, and difficult to access. Communities, researchers, and policymakers need a unified platform to visualize real-time and historical pollution data to make informed decisions about environmental health.
My Role
Contributed to the AirQo Nexus platform development, building data visualization components, real-time data pipelines, and the interactive map interface for exploring air quality monitoring stations across Africa.
Approach
Built on the AirQo platform infrastructure with real-time data ingestion from Binos air quality monitors. Interactive mapping with station overlays, historical data visualization with charts and trends, and responsive design for mobile field use. Redux state management with dynamic theming per group. PostHog analytics for product insights.
Hardest Decision
Handling the data quality challenges inherent in low-cost air quality sensors. Built visualizations that accurately represent sensor uncertainty without undermining user confidence in the data. Solutions included confidence indicators and data quality flags that communicate reliability without hiding potentially useful readings.
Status
Live at nexus.airqo.net. Provides real-time air quality data visualization across African cities with multi-tenant theming and group-based dashboards. Part of AirQo's suite of products serving communities, researchers, and policymakers.
What I'd Change
Would add predictive air quality forecasting using machine learning, implement community-contributed data sources, and add accessibility features for visually impaired users.